
浙江之源资产评估有限责任公司
A Brief Commentary on the National Coal Market Prosperity Index for August 2016
Release time:
2016-09-30
Source:
National Coal Industry Network, 2016-09-20
In August, the effects of the production-control policy became further apparent, driven by seasonal factors. Coal Demand has clearly exceeded expectations. Heavy rainfall in many regions during the summer has disrupted coal transportation. As a result of the combined impact of a series of fundamental factors and temporary, occasional influences, the supply-and-demand situation for coal has further improved. Market participants’ psychological expectations have become increasingly irrational and optimistic, intensifying market tensions and driving up prices. Coal prices The national coal market prosperity index saw another substantial rebound compared to the previous month, turning positive and entering the normal range. In September, as coal demand declined seasonally, the state activated its secondary contingency plan aimed at stabilizing coal supply and curbing the rapid rise in coal prices. As a result, coal supply is expected to increase, and market sentiment is gradually returning to rationality. It is anticipated that the national coal market prosperity index will continue its upward trend, driven by inertia, though the magnitude of the increase will not be significant.
I. Basic Situation of the Coal Market Prosperity Index for August
In August, the nationwide coal market prosperity index stood at 6.2 points, marking the first reversal to positive territory since December 2013. This represents a substantial rebound of 22 basis points from the previous month’s final value (-16.2), bringing the index into the normal range.
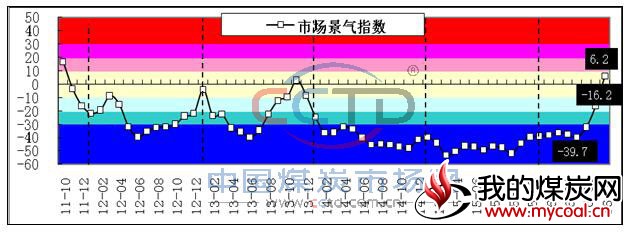
Figure 1: Trend Chart of the Coal Market Prosperity Index
(1) The demand divergence index continues to rise. In August, the underlying economic fundamentals strengthened their pull on coal demand. The value added of industrial enterprises above designated size rose by 6.3% year-on-year, an increase of 0.3 percentage points from July. Production of pig iron and cement grew by 3.6% and 1.0% year-on-year, respectively, with growth rates up by 1.9 and 0.1 percentage points from the previous month. In August, fixed-asset investment (excluding rural households) rose by 0.58% month-on-month, and from January to August, the growth rate of nationwide real estate development investment increased by 0.1 percentage point compared to the period from January to July. Moreover, with persistently high temperatures in August, air-conditioning loads remained significantly higher than normal levels, keeping total power generation at a relatively high growth rate of 7.8%. However, hydropower generation growth slowed down to 5.5% that month, with average daily output falling by 10.6% month-on-month, thus freeing up some capacity for thermal power generation. As a result, thermal power generation growth reached 7.5% year-on-year in August, an increase of 3.1 percentage points from July, and average daily output rose by 6.4% month-on-month. Driven by both fundamental and climatic factors, electricity coal consumption surged again year-on-year that month, further boosting the overall coal demand trend. The demand deviation index for August was -5.0 points, up 5.3 basis points from the final value in July (-10.3).
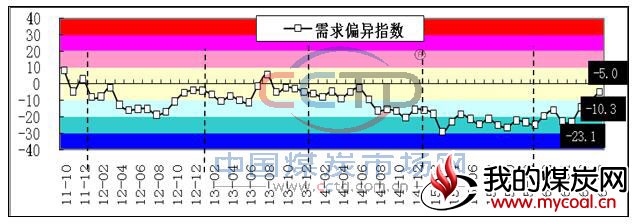
Figure 2: Trend Chart of the Coal Demand Deviation Index
(2) The supply-demand balance index has rebounded significantly. In August, consumption of commodity coal rose by 1.6% compared to July. Among enterprises above a designated size, raw coal production fell by 11.0% year-on-year, but the decline narrowed by 2.1 percentage points from the previous month, while increasing by 3.0% month-on-month. Coal imports surged, with a year-on-year growth rate of 52.1% and a month-on-month growth rate of 25.4%. Overall, coal supply during the month continued to fall short of demand. As daily coal consumption rose, the number of days' worth of coal inventory available for rotation across the entire society continued to decline, further moving the supply-demand balance toward equilibrium. Taking into account the base effect from the previous month, the supply-demand balance index for August came in at -5.1, up 14.5 basis points from the final value for July (-19.6).
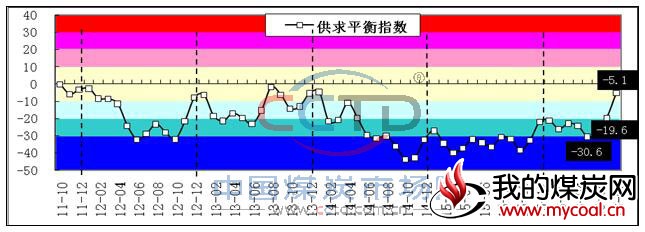
Figure 3: Trend Chart of the Coal Supply-Demand Balance Index
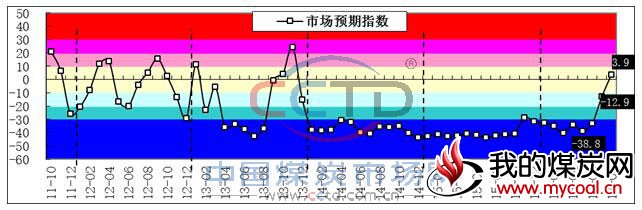
(3) Psychological expectations have reversed, and the market expectation index has risen sharply. Since 2014, market participants’ psychological expectations regarding the coal sector have remained consistently extremely pessimistic. This pessimistic mood continued into the first half of this year. Despite the significant positive factor of the “276-day coal production limit,” there is still a general lack of confidence in the effectiveness of policy implementation. Most market players believe that this year the coal market will continue to be characterized by oversupply, with little incentive to build up coal inventories. As a result, many users are adopting lower consumption levels and preparing for the summer peak demand with overall relatively low inventory levels. Later, as the effects of the production-control policies gradually became evident—and coupled with seasonal demand exceeding expectations—market participants’ psychological expectations began to reverse. This shift was reflected in the market by an accelerating “buy-on-rise” mentality, with eager efforts to replenish inventories. Some intermediaries became reluctant to sell, and the combination of these multiple factors caused market expectations to diverge significantly from the market’s actual fundamentals. As a result, the coal market expectation index rose from July’s final value of -12.9 points to 3.9 points in August, representing a substantial increase of 15 basis points.
(4) The price deviation index has rebounded sharply into the “very hot” range. 5,500 kcal/kg for the Bohai Rim region in August Power coal The closing price rose by 58 yuan/ton, representing an increase of 13.3%. Prices for coking coal in major producing regions continued to climb, and the coal price dispersion index rebounded by 11.6 basis points from July’s final value of 10.9 to 22.5 points.
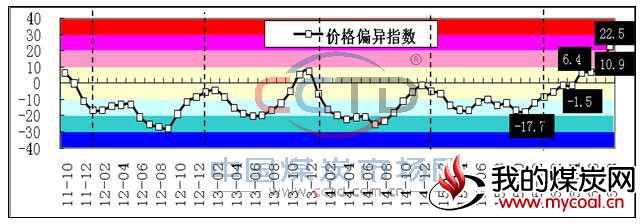
Figure 5: Trend Chart of the Coal Price Deviation Index
II. Forecast of the Coal Market Prosperity Index for September
(1) Coal Demand: From an economic fundamentals perspective, during the period from January to August, the growth rates of planned total investment in newly started projects and the area of newly started housing construction both declined by 1.3 and 1.5 percentage points, respectively, compared to the period from January to July. However, the growth rate of infrastructure investment accelerated by 0.1 percentage point. Moreover, as the adverse impact of weather on construction activities gradually diminishes, we expect that, taking all these factors into account, the underlying economic fundamentals will continue to exert a relatively stable pull on coal demand. From a seasonal perspective, electricity consumption driven by air-conditioning loads is set to decline in September, significantly weakening the climate’s boost to demand for power coal. Consequently, the year-on-year growth rate of power coal consumption is expected to slow down somewhat. Nevertheless, given the sustained upward momentum of the demand deviation index over the previous months, we anticipate that power coal consumption will still see a modest rebound in September.
(2) Supply and Demand Relationship: The efforts to reduce coal overcapacity have yielded positive results, effectively curbing overcapacity production, illegal and non-compliant production, and the production of low-quality coal. Currently, supply in some coal-producing regions has begun to tighten. In early September, the National Development and Reform Commission activated a secondary contingency plan aimed at stabilizing coal supplies and curbing the rapid rise in coal prices. As a result, national daily coal production increased by 300,000 tons. It is expected that coal production in September will show a month-on-month increase, while commercial coal consumption will experience a seasonal decline. Since September, coal stocks at northern ports have rebounded, and coal stocks at power plants have remained largely stable. Overall societal inventories are projected to see a modest recovery. Given the substantial rebound in the supply-demand balance index in August, we anticipate that this index will continue to rise in September, though the magnitude of the increase will be significantly smaller.
(3) Market Expectations: Currently, the reversal in coal market expectations contains, to some extent, irrational elements. It overlooks the cumulative impact of temporary and contingent factors, thereby deviating from the true underlying supply-and-demand fundamentals. In the coming period, as seasonal demand declines and the phased impact of flooding gradually subsides, the situation of localized coal supply tightness is expected to ease—especially with the proactive guidance from regulators toward market rationality and the activation of emergency response plans. These factors will help bring market participants’ psychological expectations back to a more rational level, leading us to anticipate that the market expectation index for September will once again fall into the negative range.
(4) Market Price: Currently, seasonal demand has declined, but after the market volatility experienced over the past two months, users are eager to replenish their inventories, resulting in heightened purchasing enthusiasm and a strong upward momentum in prices. Since September, prices along the Bohai Sea region have continued to rise at an unabated pace, increasing by 43 yuan per ton as of September 14. At the beginning of September, major coking coal producers such as Shanxi Coking Coal once again raised coking coal prices by between 30 and 95 yuan per ton. In the second half of the month, as localized supply tightness eases somewhat, the pace of price increases will likely slow down. However, considering the previous price hikes, it is expected that the coal price deviation index for September will remain on an upward trend.
In summary, among the four fundamental indicators of the national coal market prosperity index, the demand deviation index, the supply-demand balance index, and the price deviation index are expected to show a slight rebound. However, the market expectation index is forecast to decline noticeably. Taking all these indicators into account, it is anticipated that the national coal market prosperity index for September will continue its upward trend by inertia, though the magnitude of this increase will not be significant.
Links:
Address: Room 909, 9th Floor, Science & Technology Building, Eastern Software Park, No. 90 Wensan Road, Hangzhou City, Zhejiang Province Telephone:0571-85115488

Scan with your phone
Open the mobile website