
浙江之源资产评估有限责任公司
It’s risen and fallen, and over the past six months, we’ve traveled across countless rivers and mountains... A stock market epic in 17 illustrations.
Release time:
2015-07-29
Source:
In the past six months, China’s stock market has been unprecedented—shifting from one surge after another to repeated plunges and then back to fresh surges; from buying and buying to selling and selling and then back to buying again—all of this has unfolded within just six months. Such dramatic ups and downs, full of twists and turns, resemble an epic saga. If you’ve been part of it yet managed to come through unscathed, and if you look back on it two decades later, you’ll surely feel a sense of pride in having witnessed history firsthand.
Over the past six months, your mood might have been like this...

The first five months were filled with joy and excitement, but by June, my mood took a sharp downturn. This stock market crash that just ended has left everyone utterly exhausted. Looking back now at the first half of the year in the stock market, we realize that the sharp decline had actually been foreshadowed long ago.
The 2015 Half-Year Report on the Stock Market provides a statistical description of several key features that emerged in the first half of the year for the entire A-share market, and compares them with those of the 2007 bull market as well as major global stock markets this year. Using data, it reveals how this round of bull market has unfolded in the first half of the year.
I. Are there more “new leeks” from the East?
In the first half of 2015, a new term—"fifth-generation investors"—emerged, referring to the new wave of stock market investors born in the 1980s and 1990s. Veteran investors commented on this phenomenon, saying, "The 'leeks' are back in the market again." Data shows that these fresh "leeks" are concentrated mainly in the eastern coastal regions, with Beijing, Shanghai, Guangzhou, Zhejiang, Jiangsu, and Shandong being the areas where they are most prevalent.
In terms of timing, April to June marks the peak germination period for "leek" (Chinese chives). As analyzed in Figure 2, starting from April, the stock market’s profitability became markedly evident, attracting a large influx of new investors. In May, affected by repeated market fluctuations, the number of new accounts opened saw a slight decline. Notably, after reaching an intrayear high of 5,178 points in early June, A-shares began a downward trend; however, the number of new accounts opened did not show any significant decline.

(Figure 1)

(Figure 2)
II. A slow bull market paired with a fast bear market—tell me, are you scared?
In the first half of 2015, all three major stock indices saw more days of gains than days of losses. However, the average gain on days when the markets rose was lower than the average loss on days when they fell. This suggests that, overall, this bull market has been characterized by a “slow rise followed by a sharp fall” pattern.
Here, let me clarify for everyone how the overlapping calculations work between gains and losses. Suppose your stock first rises by 10% and then falls by 10%. In this case, you’d still end up with a 1% loss. Conversely, if your stock first falls by 10% and then rises by 10%, you’d also end up with a 1% loss. From this, you can see that when the magnitude of gains and losses is equal, you’ll still come out losing money. Therefore, when the average decline exceeds the average gain, it signals a period of market volatility—and your probability of incurring a loss is at least 70%. The principle of “one profit, two even, seven losses” remains valid even during bull markets.
Wait a minute—did I forget to mention the ChiNext board’s “nervous volatility”? Its average gain or loss has consistently exceeded 2%, and there have been as many as 22 days when it surged by more than 3%... These figures clearly demonstrate that our beloved ChiNext board has earned its nickname “Divine Innovation Board” through sheer strength. However, looking at it from the opposite perspective, given that the ChiNext board’s growth rate far outpaces that of the Shanghai and Shenzhen main boards, it’s only natural that its price-to-earnings ratio has soared to the point where it’s dubbed the “Dream Price Ratio” or even the “Daring Price Ratio.”


(Figure 4)
III. Stock Market Volatility Takes You for a Ride
At the opening, the portfolio was fully invested and in the green; by closing, it had turned entirely red. This kind of thrilling experience wasn't uncommon in the first half of the year. So just how intense were those market swings?
After整理ing the volatility data for the three major stock indexes in the first half of the year, I made a “surprising” discovery: In just half a year, I’ve already been on so many “roller coaster” rides—now it feels like my life is completely fulfilled!
See that biggest circle in Figure 5? The ChiNext Index’s single-day price fluctuation reached 14.49%. Note that this isn’t the fluctuation of any individual stock. You could say that most ChiNext stocks that day went through a dramatic journey—from hitting their daily limit-down to hitting their daily limit-up. Talk about an exhilarating ride—definitely not something heart patients should try!
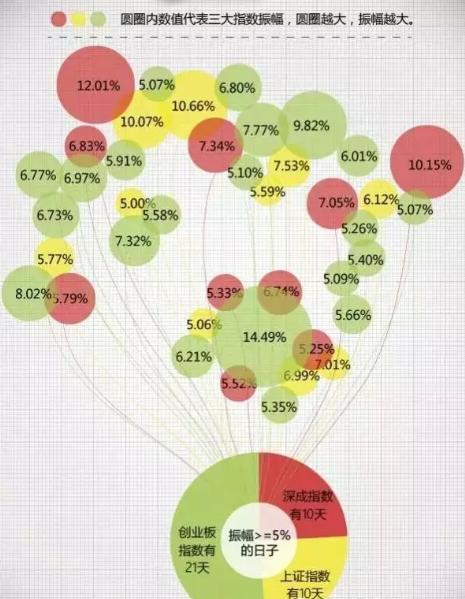
(Figure 5)
4. Success and failure both stem from new stocks.
Once upon a time, when IPOs came along, investors were overjoyed—after all, they could once again snap up new stocks and make money. Yet it was precisely these new stocks that ended up being both the source of their success and their downfall. As the broader market plunged from its peak of 5,178 points, most people’s arrows of criticism once again began to point squarely at new stocks.
Judging from the impact of funds raised through IPOs, investors have not been wrong to place their trust in new stocks. The amount of capital frozen for each batch of newly listed stocks has risen steadily from 1.6 trillion yuan in January to as high as 7 trillion yuan for the two batches frozen around June.
From the perspective of both the number and scale of IPOs, the first half of the year continued to show an upward trend. Starting in May, the CSRC began approving IPOs twice a month, and large-cap stocks such as China National Nuclear Corporation and Guotai Junan subsequently went public one after another. This inevitably brings to mind PetroChina in 2007: On November 5, 2007, PetroChina listed on the A-share market, reaching a peak price of 48.62 yuan on that very day. The next day, however, it opened sharply lower and continued to decline, initiating a prolonged 12-month slump. By November 4, 2008, PetroChina’s closing price had fallen to 10.35 yuan, with a cumulative drop approaching 80%. Almost all investors who had purchased this stock were left with virtually nothing.


V. The “funding bull” has come to a halt.
The balance of margin trading and short selling has risen steadily from 1 trillion to a peak of 2.2 trillion, driven by a massive influx of leveraged funds into the stock market. At one point, margin trading was considered the biggest driver behind the current bull market in A-shares.
Accompanying the simultaneous growth in margin trading balances has been an intensification of regulatory oversight by the authorities. It began on January 16, when the CSRC released a report on its inspection of securities firms’ financing businesses and proposed disciplinary measures against 12 securities firms found to have violated regulations—this directly triggered the “January 19 Stock Market Crash,” during which the Shanghai Composite Index plunged by 7.7% on that day.
Subsequently, on April 3, the CSRC released the results of its inspection of securities firms’ margin trading and financing businesses, noting that six securities firms—including CICC—had been subject to regulatory measures.
Then, on April 18, the CSRC announced that it would regulate financing activities from seven aspects and encourage short selling.
By June 12, the Shanghai Composite Index reached its highest point of the year at 5,178 points. On that same day, the China Securities Regulatory Commission released a draft of the Management Measures for Margin Trading and Short Selling, proposing to impose limits on the scale of securities firms’ financing and margin trading businesses.
The willful “leveraged bull” ultimately had no choice but to lower its proud head in the face of regulation.
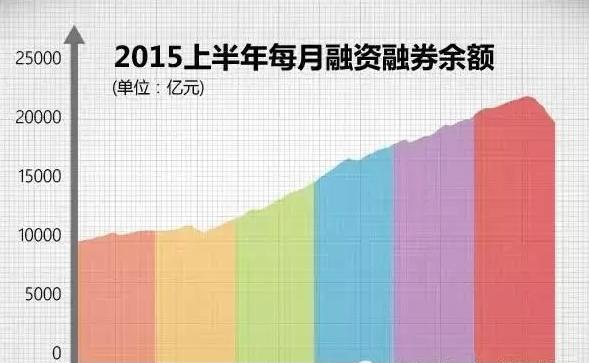
This point is also confirmed by the trading volumes of the two markets. In the first five months, trading volumes in both markets continued to rise, with Shanghai’s trading volume once exceeding 1 trillion yuan. By mid-June, however, trading volumes in both Shanghai and Shenzhen plummeted rapidly.

6. The Shanghai-Hong Kong Stock Connect continues to show a “hot in the north, cold in the south” pattern.
Everyone is eagerly anticipating the launch of the Shenzhen-Hong Kong Stock Connect in the second half of the year. But how’s its “older brother,” the Shanghai-Hong Kong Stock Connect, doing so far?
As shown in Figure 8, the trading volume of Stock Connect Shanghai generally exceeds that of Stock Connect Hong Kong. Moreover, a comparison between the Shanghai and Hong Kong markets reveals a clear trend: the Shanghai Composite Index has risen far more than the Hang Seng Index over the same period.
However, the Shanghai-Hong Kong Stock Connect has not become as popular as initially anticipated. As is well known, the daily quota for Shanghai Stock Connect is 13 billion yuan, while the daily quota for Hong Kong Stock Connect is 10.5 billion yuan. Yet on most trading days, the total transaction volume of the Shanghai-Hong Kong Stock Connect has failed to reach these quota ceilings.
Tip: The quota for the Shanghai-Hong Kong Stock Connect is calculated based on the net offset after offsetting buy and sell transactions. This means that the actual transaction volume supported by the Shanghai-Hong Kong Stock Connect can exceed the quota itself.

7. Stock values “keep changing and changing”
In a bull market, there are always stocks that transform from “ordinary chickens into phoenixes.” Our editor has meticulously compiled the growth stories of these “phoenixes.” Before the stock market began its sharp downward plunge on June 15, as many as 1,072 stocks had seen their valuations double—among them, eight stocks had experienced an astonishing 500% surge in value. Yet just two weeks into the subsequent correction, the number of stocks with doubled valuations had been “halved.”
Due to the consecutive sharp declines in early July, the editor specifically compiled stock price data as of July 8 and found that the vast majority of “Phoenix” stocks have been stripped of their gains—stocks with gains exceeding 100% have plummeted from 1,400 to just 200.
BUT! There’s one stock that has maintained its position as a high-growth leader from start to finish. From the beginning of the year through the close on June 24, Shagang Shares surged by as much as 587%. The clever part is that, starting from June 25, Shagang Shares has been suspended from trading until now—thus successfully avoiding this round of sharp declines.
The editor just wants to say to everyone who’s bought shares of Shagang Group: This is going to take off!

8. The price-to-earnings ratio of the stock market has already exceeded that of the “6124-point” level.
The editor has compiled a list of stocks that were traded in both 2007 and 2015, using data from October 16, 2007 (the day the broader market reached 6,124 points) and June 30, 2015, respectively.
Data show that after the first half of the year, 791 stocks had price-to-earnings ratios higher than the level at the “6124-point” peak, while another 677 individual stocks had P/E ratios below that level. In the competition between the “first bull stocks” of the two bull markets, Changbai Group, with a P/E ratio of 44,912 times, utterly outperformed Yueyang Xingchang—the stock with the highest P/E ratio in 2007.
Thus, it is evident that when the real economy shows no significant improvement, the bull market driven by massive leveraged funds contains even more bubbles.

9. Just how impressive are A-shares, exactly?
Everyone says this bull market in A-shares is truly remarkable—just how remarkable exactly? Our editor compared A-shares with several other “fellow players” around the globe. Over the past three months, A-shares really didn’t stand out; on the contrary, stock markets in countries like Germany and Russia kept climbing steadily.
Starting in April, A-shares entered a bull market, surging steadily upward—while, by contrast, major global stock markets were on a downward trajectory. Even though A-shares began to experience a sharp correction in June, their cumulative gains for the first half of the year still significantly outpaced those of other stock markets.

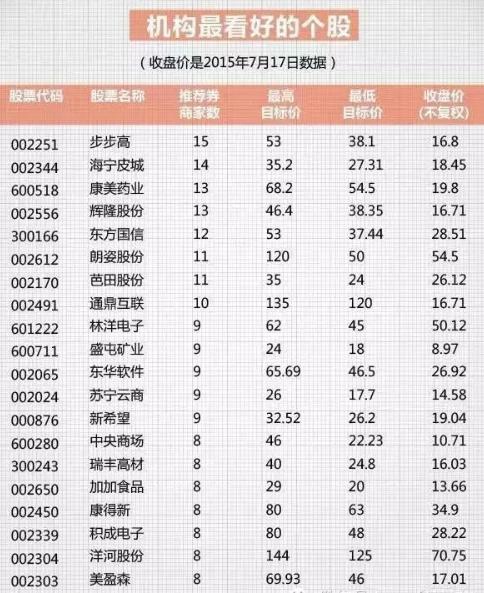
X. What’s the securities firms’ outlook on the stock market in the second half of the year?
Anxin Securities: Since the beginning of this year, the stock market has increasingly been driven by speculative trading dynamics. From a game-theoretic perspective, the risk of monetary tightening remains very low before the end of this year, and the supply of tradable shares is unlikely to surge dramatically. Thematic investment concepts continue to fuel upward momentum in the stock market, and there are no clear signs yet that the bull market is coming to an end.
Guojin Securities: In the short term, there’s a possibility that the A-share market could experience another artificial “rebound,” potentially climbing to around 4,500 points. From the current perspective, there are three key reasons for this rebound: First, new stock issuances have been temporarily suspended; second, the government is actively stepping in with real financial support; and third, continuous policy measures are being introduced, all of which should help the A-share market stage a rebound. However, due to factors such as the ongoing reallocation of household assets, excessively high valuations, the implementation of the registration-based system for new stocks, and liquidity constraints, the magnitude of this rebound won’t be particularly significant.
CITIC Securities: Given the current situation in which traditional industry companies continue to struggle to deliver strong performance, the Shanghai Composite Index (SSEC)—which has a relatively large weighting in traditional sectors—is expected to fluctuate around the 5,500-point mark in the second half of the year, with an operating range of 4,500 to 6,500 points. Meanwhile, the ChiNext Index, which represents the new economy, is poised to challenge the 4,500-point level and is likely to outperform the main board market.
Guangda Securities: If the market maintains the capital inflow and outflow pattern seen in April and May, and no other risk factors emerge, the Shanghai Composite Index could reach 7,000 points in the second half of the year, while the ChiNext Index might climb as high as 8,000 points. If, in the future, monthly new capital inflows amount to 1 trillion yuan and outflows to 300 billion yuan, both the Shanghai Composite Index and the ChiNext Index could rise to 6,000 points within six months. He said that a bull market doesn't follow a straight line from its low to its high—experiencing fluctuations is perfectly normal.
Guotai Junan: If the economy follows a U-shaped recovery, the bull market will have no clear peak—focus on heavy positions for the future. China Manufacturing 2025 represents a major growth opportunity; we recommend allocating resources across three key areas: smart manufacturing, the industrial internet plus, and application-end sectors.

Links:
Address: Room 909, 9th Floor, Science & Technology Building, Eastern Software Park, No. 90 Wensan Road, Hangzhou City, Zhejiang Province Telephone:0571-85115488

Scan with your phone
Open the mobile website