
浙江之源资产评估有限责任公司
Nonferrous Metals Enterprise Confidence Index Report (Q2 2018)
Release time:
2018-07-20
Source:
China Nonferrous Metals News, July 6, 2018
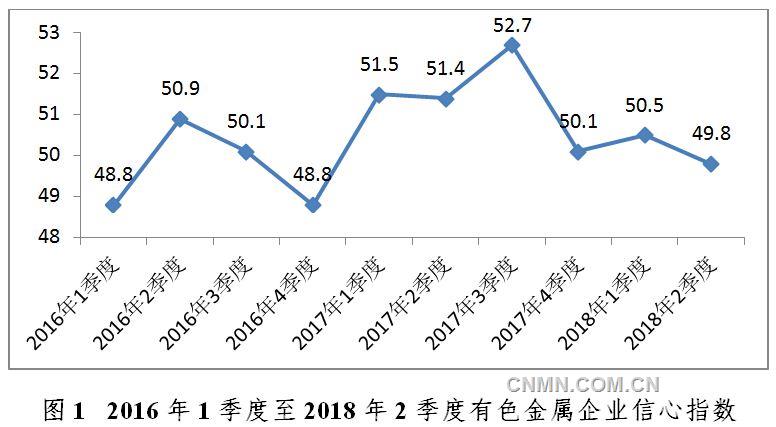
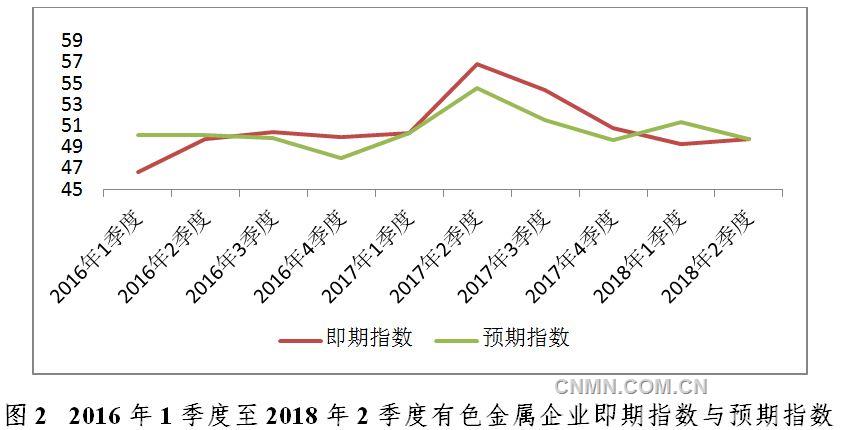
In the second quarter of 2018, the confidence index for non-ferrous metal enterprises stood at 49.8, slightly below the critical threshold and down 0.7 percentage points from the previous period. Specifically, the spot index was 49.8, and the expectations index was also 49.8, indicating a slight decline in non-ferrous metal enterprises’ confidence in the industry’s performance.
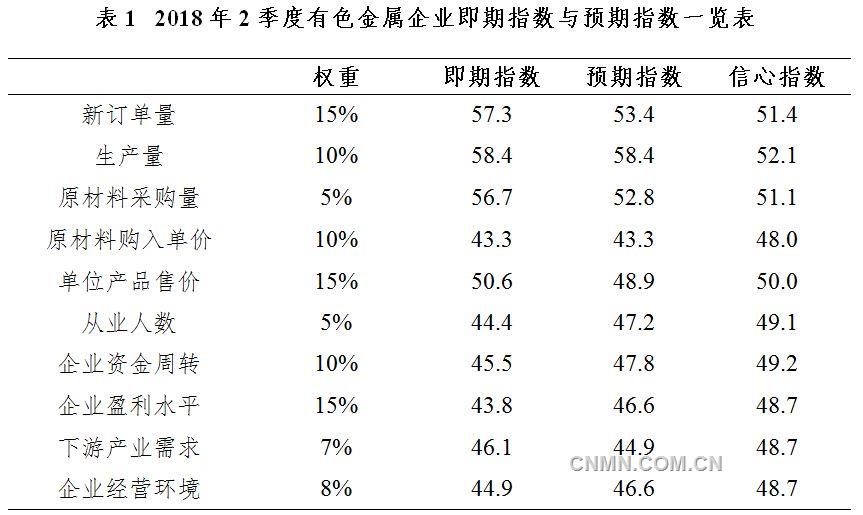
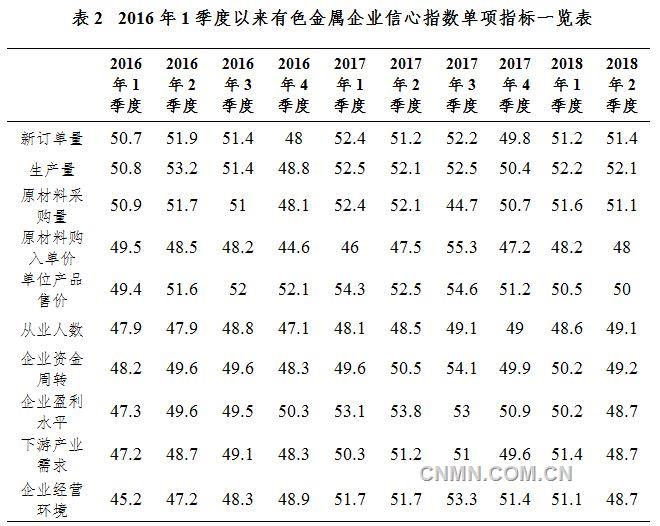
This issue’s confidence index for non-ferrous metal enterprises consists of a total of 10 individual indicators. Among these, four indicators are at or above the critical threshold, including the new orders index, the production volume index, the raw materials procurement volume index, and the unit product selling price index. Six indicators, on the other hand, are below the critical threshold, namely the raw materials purchase unit price index, the number of employees index, the enterprise fund turnover index, the enterprise profitability index, the downstream industry demand index, and the enterprise operating environment index. For detailed analysis, please refer to Table 2 and the individual sub-indicators.
1. New Orders Index
The new orders index for this period was 51.4, up 0.2 from the previous period and above the critical threshold, indicating an accelerated pace of growth in market demand within the industry.
2. Production Index
The production index for this period was 52.1, down 0.1 from the previous period, indicating that the pace of industry production expansion has slowed somewhat, yet remains above the critical threshold.
3. Raw Materials Procurement Volume Index
The index for this period’s raw material procurement volume was 51.1, down 0.5 from the previous period but still above the critical threshold.
4. Index of Unit Purchase Prices of Raw Materials
The current period’s index of unit purchase prices for raw materials stood at 48, down 0.2 from the previous period and below the critical threshold.
5. Unit Product Sales Price Index
The unit product price index for this period is 50, down 0.5 from the previous period and at the critical threshold.
6. Employment Index
The employment index for this period was 49.1, up 0.5 from the previous period but still below the critical threshold, indicating that the decline in employment by firms in the industry has narrowed.
7. Corporate Liquidity Turnover Index
This period's corporate liquidity index stood at 49.2, down 1.0 from the previous period and below the critical threshold.
8. Corporate Profitability Index
The corporate profit index for this period stood at 48.7, down 1.5 from the previous period and below the critical threshold.
9. Downstream Industry Demand Index
The downstream industry demand index for this period was 48.7, down 2.7 from the previous period and below the critical threshold.
10. Business Environment Index
The business environment index for this period is 48.7, down 2.4 from the previous period and below the critical threshold.
Overall, the confidence index for non-ferrous metal enterprises has declined slightly compared to the previous period, indicating a weakening of businesses’ confidence in the market. However, several indicators—such as the new orders index and the production volume index—remain above the critical threshold, suggesting that the overall production situation in the non-ferrous metals industry continues to be stable with a positive outlook. At the same time, it’s important to note that six indicators—including the unit price of raw material purchases and profit levels—remain below the critical threshold. The primary reasons for this trend can be attributed to two main factors: First, the development of the non-ferrous metals industry still faces constraints such as declining corporate profitability and rising costs, which warrant our continued attention in the future. Second, recently, as U.S.-China trade tensions have intensified, the U.S. government’s move to raise tariffs on Chinese exports has also triggered concerns among enterprises about future prospects.
(Written by: Zhang Nian)
Note:
1. The Confidence Index for Nonferrous Metals Enterprises is an index compiled and calculated based on quarterly survey results from key enterprises in the nonferrous metals sector. It is primarily used to assess the current state of the nonferrous metals industry. This index is released once per quarter, with the first quarter covering December, January, and February of the previous year; the second quarter covering March, April, and May; the third quarter covering June, July, and August; and the fourth quarter covering September, October, and November.
2. Calculation Method: Data required for each sub-indicator will be collected from key contact enterprises via a survey questionnaire. For each individual sub-indicator, the diffusion index will be calculated as follows: the percentage of enterprises giving optimistic responses plus half of the percentage of enterprises reporting no change. The confidence index for nonferrous metal enterprises is a composite index consisting of the current-confidence index and the expected-confidence index. Both indices are calculated by weighting 10 individual sub-indicators, with the selection of these sub-indicators and their respective weights based on their degree of leading influence on the economy.
3. The 10 individual indicators involved and their respective weights are as follows: New Orders Index (15%), Production Index (10%), Raw Materials Purchase Volume Index (5%), Unit Price Index of Raw Material Purchases (10%), Unit Product Selling Price Index (15%), Number of Employees Index (5%), Enterprise Funds Turnover Index (10%), Enterprise Profitability Index (15%), Downstream Industry Demand Index (7%), and Business Environment Index (8%).
Links:
Address: Room 909, 9th Floor, Science & Technology Building, Eastern Software Park, No. 90 Wensan Road, Hangzhou City, Zhejiang Province Telephone:0571-85115488

Scan with your phone
Open the mobile website