
浙江之源资产评估有限责任公司
The National Bureau of Statistics released data on changes in the national industrial producer price index for July.
Release time:
2015-08-12
Source:
(Editor’s Note: This year 1 As of July, producer prices in mining-related industries fell significantly year-on-year, including the mining, ore-processing, and manufacturing sectors. This decline was particularly pronounced in the oil and gas, coal, and ferrous metals industries.
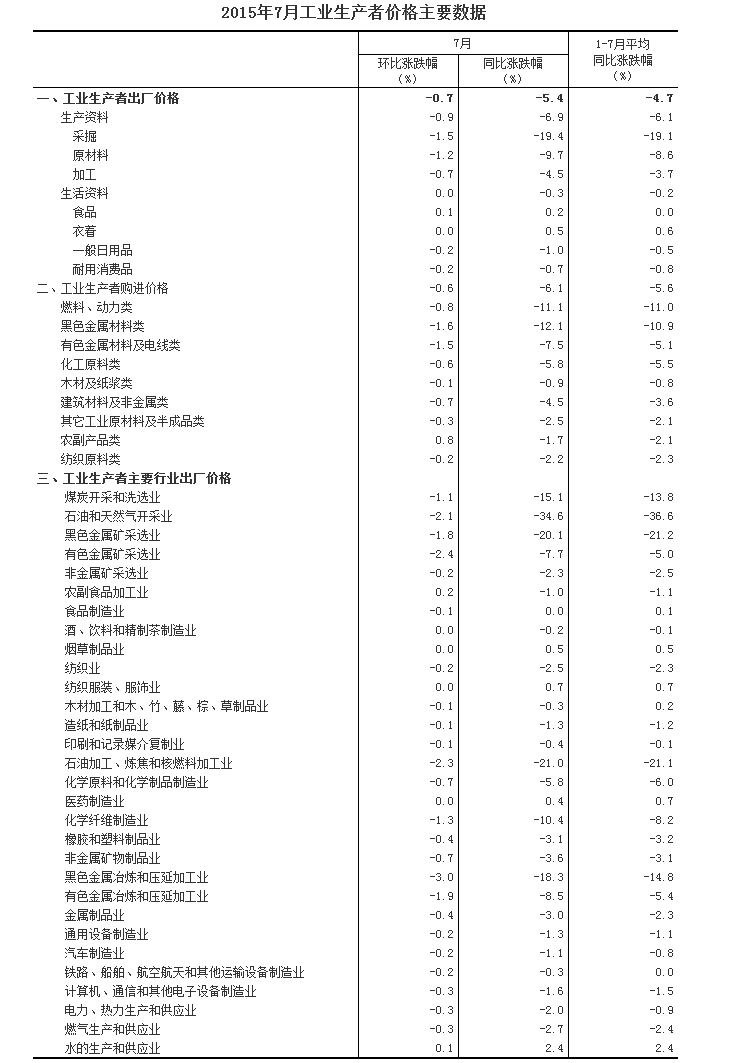
In July 2015, the national ex-factory price index for industrial producers fell by 0.7% month-on-month and by 5.4% year-on-year. The purchase price index for industrial producers declined by 0.6% month-on-month and by 6.1% year-on-year. From January to July, on average, the ex-factory price index for industrial producers fell by 4.7% year-on-year, while the purchase price index for industrial producers dropped by 5.6% year-on-year.
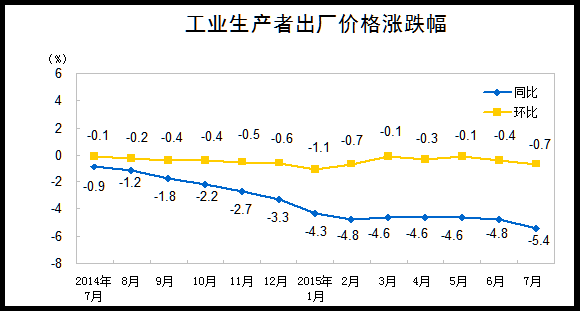
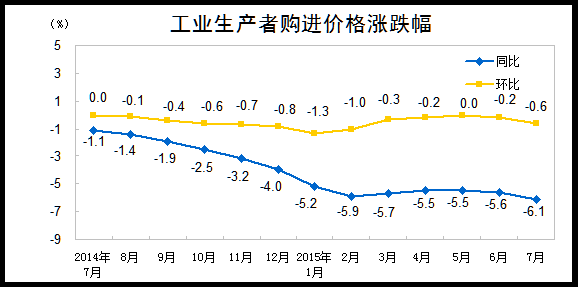
I. Year-on-Year Changes in Producer Prices for Industrial Products
Among the ex-factory prices of industrial producers, prices of means of production fell by 6.9% year-on-year, lowering the overall level of national industrial producer ex-factory prices by approximately 5.3 percentage points. Specifically, prices in the mining industry declined by 19.4%, prices in the raw materials industry fell by 9.7%, and prices in the processing industry dropped by 4.5%. Prices of consumer goods fell by 0.3% year-on-year, reducing the overall level of national industrial producer ex-factory prices by about 0.1 percentage point. Among these, food prices rose by 0.2%, clothing prices increased by 0.5%, prices of general daily-use articles fell by 1.0%, and prices of durable consumer goods declined by 0.7%.
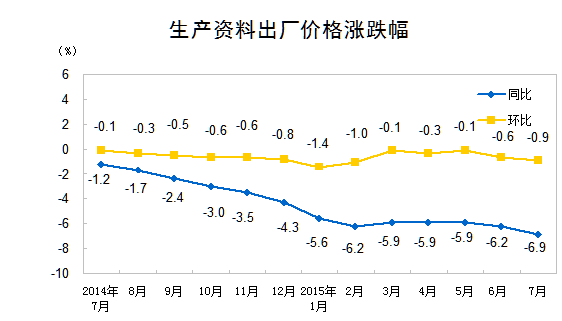
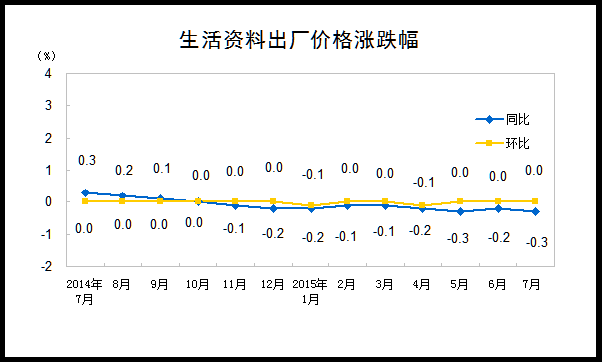
According to calculations, of the 5.4% year-on-year decline in the nationwide ex-factory price index for industrial producers in July, the carryover effect from last year’s price changes accounted for approximately -2.1 percentage points, while new price increases contributed about -3.3 percentage points.
Among the purchase prices of industrial producers, prices for ferrous metal materials fell by 12.1% year-on-year, fuel and power prices dropped by 11.1%, prices for non-ferrous metal materials and wires declined by 7.5%, and prices for chemical raw materials decreased by 5.8%.
II. Monthly Changes in Producer Prices for Industrial Products
Among the ex-factory prices of industrial producers, prices of means of production fell by 0.9% month-on-month, dragging down the overall level of national industrial producer ex-factory prices by approximately 0.7 percentage points. Specifically, prices in the mining industry declined by 1.5%, prices in the raw materials industry fell by 1.2%, and prices in the processing industry dropped by 0.7%. Prices of consumer goods remained unchanged month-on-month (with a fluctuation rate of 0; the same applies below). Among these, food prices rose by 0.1%, clothing prices stayed flat, while prices of general daily necessities and durable consumer goods both fell by 0.2%.
Among the purchase prices of industrial producers, prices for ferrous metal materials fell by 1.6%; prices for non-ferrous metal materials and wires declined by 1.5% month-on-month; fuel and power prices dropped by 0.8%; and chemical raw material prices decreased by 0.6%. Meanwhile, prices for agricultural and sideline products rose by 0.8%.
Note
1. Indicator Explanation
The Industrial Producer Price Index includes the Producer Price Index for Industrial Products (PPI) and the Industrial Producer Purchase Price Index.
The Industrial Producer Price Index reflects the trend and magnitude of changes in ex-factory prices when industrial enterprises sell their products for the first time.
The Producer Purchase Price Index reflects the trend and magnitude of changes in purchase prices of intermediate input products by industrial enterprises.
2. Statistical Scope
The statistical survey on ex-factory prices of industrial producers covers the prices of more than 11,000 industrial products across 1,702 basic categories; the statistical survey on purchase prices of industrial producers covers the prices of more than 6,000 industrial products across over 900 basic categories.
3. Research Methodology
The industrial producer price survey employs a combined approach of key surveys and typical surveys. Enterprises with annual main business revenues exceeding 20 million yuan are surveyed using the key survey method, while enterprises with annual main business revenues below 20 million yuan are surveyed using the typical survey method. The industrial producer price survey covers nearly 60,000 industrial enterprises in more than 400 cities nationwide.
4. The basis for the classification standards of industrial sectors is the “Classification of National Economic Industries” (GB/T 4754-2011).
Previous page
Links:
Address: Room 909, 9th Floor, Science & Technology Building, Eastern Software Park, No. 90 Wensan Road, Hangzhou City, Zhejiang Province Telephone:0571-85115488

Scan with your phone
Open the mobile website